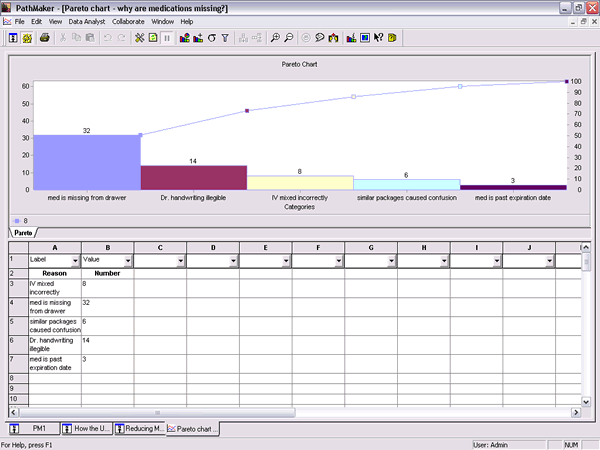
PathMaker's Data Analyst tool helps you integrate actual process data with management and planning tools. That's unusual in itself. The Data Analyst also has innovations which mean that non-statisticians can easily make useful, accurate, professional charts. With all the statistics done for you.
Data Analyst offers all the major chart types required for process improvement and SPC. In a chart wizard, you can choose run charts, pie charts, scatter plots, bar charts, histograms, Pareto charts, normal test plots or one of seven common control charts (x bar s, x bar R, individual and moving range, c, u, p, and np). The wizard will even give you advice (if you ask for it) on which chart type is appropriate for your task.
Your Data Analyst window is split, with a chart in the top pane, and a spreadsheet in the bottom pane. You can enter data into the spreadsheet by hand, or do one-time imports or live links to Excel, Lotus 1-2-3, or any other ODBC-compliant data file.
The Data Analyst is extremely easy to use. If you choose a Run Chart in the chart wizard, the spreadsheet adjusts itself to offer you column headers which are appropriate for run chart data. Your chart is automatically drawn from the data you enter. Just one button stands between you and all the relevant statistics you need.
Data Analyst is easy to use, but it is definitely not a lightweight. In the spreadsheet, you can sort, filter, exclude rows, hide and unhide, protect, validate data entries, and much more. You can even fill ranges with formulas or dates or series.
With charts, you can control colors, titles, scales, point markers, 2D/3D views, legends, point labels, and many other functions. You can annotate charts, with notes, pictures, lines and scribbles. With control charts, you can opt to use given standards, and apply up to 8 out-of-control tests. With histograms, you can enter specification targets and limits, and calculate process capability indices. Scatter plots offer lines of best fit, and Pareto charts can automatically count and sort all entries in a designated column. Finally, guidelines for both data collection and interpretation are available, and are written in clear language which assumes no prior knowledge of statistical process control (SPC).


 Back
Back 
