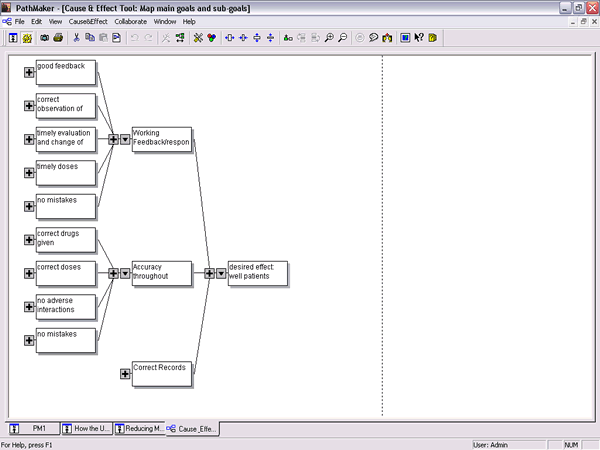
Cause & Effect Diagram or Tree Diagram Tool
PathMaker's cause and effect diagram, or Ishikawa diagram tool helps users discover the root causes of problems. The traditional fishbone shape has been superseded by a right-angled structure, which is easier to construct, read and use. Zooming in and out permits viewing either the forest or the trees. Branches can be collapsed and expanded, and the tree can flow from left to right or vice-versa. You can auto-fit text, adjust spacing, change colors, edit via drag and drop, and more.
Diagrams may be built from scratch or from data copied from a brainstorm and affinity diagram. This tool can also be used as a tree diagram, a contingency planner (PDPC Chart), a classifier and an organization chart maker.


 Back
Back 
