
Histograms
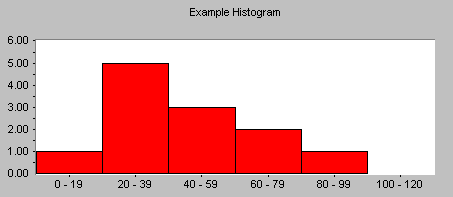
A histogram is a specialized type of bar chart. Individual data points are grouped together in classes, so that you can get an idea of how frequently data in each class occur in the data set. High bars indicate more points in a class, and low bars indicate less points. In the histogram show above, the peak is in the 40-49 class, where there are four points.
The strength of a histogram is that it provides an easy-to-read picture of the location and variation in a data set. There are, however, two weaknesses of histograms that you should bear in mind:
The first is that histograms can be manipulated to show different pictures. If too few or too many bars are used, the histogram can be misleading. This is an area which requires some judgment, and perhaps some experimentation, based on the analyst's experience.
Histograms can also obscure the time differences among data sets. For example, if you looked at data for #births/day in the United States in 1996, you would miss any seasonal variations, e.g. peaks around the times of full moons. Likewise, in quality control, a histogram of a process run tells only one part of a long story. There is a need to keep reviewing the histograms and control charts for consecutive process runs over an extended time to gain useful knowledge about a process.
Histogram statistics:
For histograms, the following statistics are calculated:
| Mean | The average of all the values. |
| Minimum | The smallest value. |
| Maximum | The biggest value. |
| Std Dev | An expression of how widely spread the values are around the mean. |
| Class Width | The x-axis distance between the left and right edges of each bar in the histogram. |
| Number of Classes | The number of bars (including zero height bars) in the histograms. |
| Skewness | Is the histogram symmetrical? If so, Skewness is zero. If the left hand tail is longer, skewness will be negative. If the right hand tail is longer, skewness will be positive. Where skewness exists, process capability indices are suspect. For process improvement, a good rule of thumb is to look at the long tail of your distribution; that is usually where quality problems lie. |
| Kurtosis | Kurtosis is a measure of the pointiness of a distribution. The standard normal curve has a kurtosis of zero. The Matterhorn, has negative kurtosis, while a flatter curve would have positive kurtosis. Positive kurtosis is usually more of a problem for quality control, since, with "big" tails, the process may well be wider than the spec limits. |
Specification Limits and Batch Performance
Where relevant, you should display specification limits on your histograms. The specifications include a target value, an upper limit and a lower limit. For example, if Michael Jordan is shooting a basketball at a hoop, his target is the middle of the hoop. His spec limits are those points in the circle of the hoop that will just allow the ball to bounce through the basket. If the shot is outside spec limits, the ball doesn't go in.
When you overlay specification limits on a histogram, you can estimate how many items are being produced which do not meet specifications. This gives you an idea of batch performance, that is, of how the process performed during the period that you collected data. PathMaker calculates the actual percentage of items in the sample that fall outside specification limits.
When you have added target, upper and lower limit lines, you can examine your histogram to see how your process is performing.
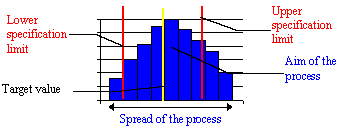
If the histogram shows that your process is wider than the specification limits, then it is not presently capable of meeting your specifications. This means the variation of the process should be reduced.
Also, if the process is not centered on the target value, it may need to be adjusted so that it can, on average, hit the target value. Sometimes, the distribution of a process could fit between the specification limits if it was centered, but spreads across one of the limits because it is not centered. Again, the process needs to be adjusted so that it can hit the target value most often.
Center of a Distribution
Processes have a target value, the value that the process should be producing, where most output of the process should fall. The center of the distribution in a histogram should, in most cases, fall on or near this target value. If it does not, the process will often need to be adjusted so that the center will hit the target value.
Spread of a Distribution
The spread, or width of a process is the distance between the minimum and maximum measured values. If the spread of the distribution is narrower than the specification limits, it is an indication of small variability in the process. This is almost always the goal, since consistency is important in most processes. If the distribution is wider than the specification limits the process has too much variability. The process is generating products that do not conform to specifications, i.e. junk.
Shape: Skewness and Kurtosis
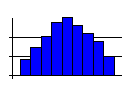
A "normal" distribution of variation results in a specific bell-shaped curve, with the highest point in the middle and smoothly curving symmetrical slopes on both sides of center. The characteristics of the standard normal distribution are tabulated in most statistical reference works, allowing the relatively easy estimation of areas under the curve at any point.
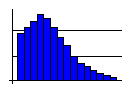
Many distributions are non-normal. They may be skewed, or they may be flatter or more sharply peaked than the normal distribution.
A "skewed" distribution is one that is not symmetrical, but rather has a long tail in one direction. If the tail extends to the right, the curve is said to be right-skewed, or positively skewed. If the tail extends to the left, it is negatively skewed. PathMaker calculates the skewness of a histogram, and displays it with the other statistics. Where skewness is present, attention should usually be focused on the tail, which could extend beyond the process specification limits, and where much of the potential for improvement generally lies.
Kurtosis is also a measure of the length of the tails of a distribution. For example, a symmetrical distribution with positive kurtosis indicates a greater than normal proportion of product in the tails. Negative kurtosis indicates shorter tails than a normal distribution would have. Again, PathMaker calculates the kurtosis of histograms.
Taken together, the values for process center, spread, skewness and kurtosis can tell you a great deal about your process. However, unless you have a solid statistics background, you will probably learn more from looking at the histogram itself than from looking at the statistics. Just remember that, where there is data in the tails near a specification limit, chances are that some non-conforming product is being made. If your process is actually making 5 bad parts in every thousand, and you are sampling 20 in every thousand, it will take some time before you find any out-of-spec parts. There are three things you should do:
- keep tracking data
- get help in fitting a curve to your distribution
- make sure your sampling plan is efficient.
PathMaker can help with the first, but not (yet) with the other two.
Distributions you may encounter
- The standard normal distribution, with its zero skewness and
zero kurtosis.
- A skewed distribution, with one tail longer than the other.
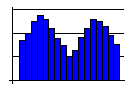
- A double-peaked curve often means that the data actually
reflects two distinct processes with different centers. You will
need to distinguish between the two processes to get a clear view
of what is really happening in either individual process.
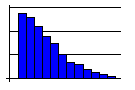
- A truncated curve, with the peak at or near the edge while
trailing gently off to the other side, often means that part of
the distribution has been removed through screening, 100%
inspection, or review. These efforts are usually costly and make
good candidates for improvement efforts.
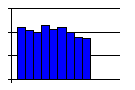
- A plateau-like curve often means that the process is
ill-defined to those doing the work, which leaves everyone on
their own. Since everyone handles the process differently, there
are many different measurements with none standing out. The
solution here is to clearly define an efficient process.
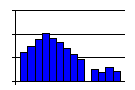
- Outliers in a histogram – bars that are removed from
the others by at least the width of one bar – sometimes
indicate that perhaps a separate process is included, but one
that doesn't happen all the time. It may also indicate that
special causes of variation are present in the process and should
be investigated, though if the process is in control before the
histogram is made as it should be, this latter option is
unlikely.
SkyMark is a software company based in Pittsburgh, Pennsylvania which focuses on creating software tools that help people improve the way they work.
Useful Links
2026 © SkyMark Corporation. All Rights Reserved.